Tissue Classification using Image Processing
and Discriminant Analysis
Relating to work conducted from 2008 to 2011
Scar Tissue Classification
Scar tissue occurs when the skin tries to repaired itself after being damaged through cuts or burns. The process of building scar tissue is quite complicated, but within a year of injury the skin will usually have recovered to what is known as a mature scar - flat and almost invisible on the skins surface. However occasionally a scar will become hypertrophic - red and itchy - and will not fully recover, in rarer cases still a scar can become a benign tumour which will continue to grow beyond the confines of the wound, although will not spread to other parts of the body. When reconstructive surgery on a burns victim is performed the operator must wait up to around one year for the scars to have settled to reduce the chances of creating such tumorous scars. It is thus important to understand the process of scaring to know when it is safe to operate and to try to identify dangerous scar tissue at an early stage of development.
Much work is still ongoing in this field and the research performed here looks at the use of non-linear optical microscopy, image processing and discriminant analysis as tools to aid in this work. While sounding like a complicated list of techniques each, in principle, is straightforward and when combined can produce some beautiful results, as discussed in the remainder of this section.
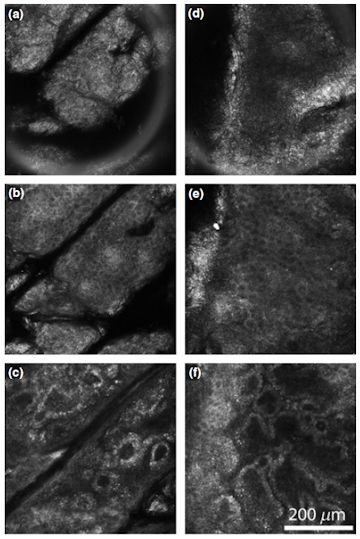
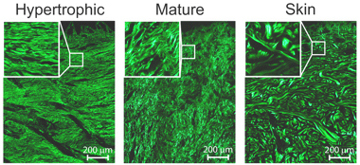 When scar tissue is viewed under a microscope it appears grey and blurry. To improve the quality of images it is usual to perform a staining step, this requires the removal of a large chunk of tissue and then to complete several chemical steps. In the last 5 years there has been a growing interest in the use of what is known as non-linear optical microscopy. This uses very short laser pulses of deep-red light to image the sample rather than the normal white light from a lamp. The advantage of using a pulsed red laser is that collagen - the material which makes up a good proportion of skin - will emit light strongly in the blue under this excitation. With the use of some filter this setup can then produce beautiful images of human tissue without the need for staining as all other materials in the skin will appear completely black, the image opposite shows several examples of these images of several tissue types. This is already useful in its own right to save a certain amount of work; however, the images produced are of such high quality and contract that they are perfect for use in computer programs to extract various features of the images to gain further information that might not be visible to the human eye.
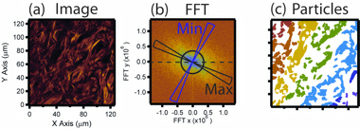 When looking at the above images of tissue, it is clear by eye that that are all different, but to define exactly what it is that is different, or to put a number on it, is often hard. The situation is made more difficult as often a small image could look like any part of any of the above images and even a professional histologist could struggle to classify it. This is where image processing can have advantages. A computer program will always perform exactly the same steps and will always come up with the same answers for the same sample and will generate numerical values not just specific labels. Hence, if the data quality is good enough the challenge comes down to teaching the computer what to do. The first step in this process is to turn the images into things the computer can understand: numbers. This is done by using the technique known as image processing. Two such examples are shown here (right). The first step is to perform what is known as a Fourier transform, these have been used in various other projects on this site, and in principle describe how much order there is in a sample. As can be seen above Hypertrophic scars are well ordered and the tissue is aligned to the skins surface, and so a Fourier transform is capable to expressing how well the collagen is aligned to the angle to the skins surfaces as well as how perfectly all the fibres are arranged. Another important technique is to separate the raw image into smaller components (also shown right). The computer can then count things like how many pieces of tissue there are in an image, or how round or big they are. When all such techniques are performed it is possible to represent a single image by a list of perhaps 50 values, expressing the above parameters as well as many more.
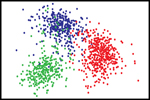
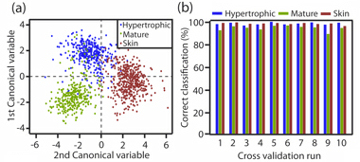 In the ideal world we might hope that looking at a single parameter might tell what sort of tissue it was, for example if all the fibres in the image where long and thin it is hypertrophic, or if they are all round it is normal skin etc. Unfortunately, biology is never this straightforward, and so even after all this work we are left with a large list of numbers that do not at first sight tell us anything new about the tissue samples. This is where the next step in the process comes in, with a technique known as discriminant analysis. This is a clever computer program that combines several different features together with the aim of making one set of numbers that can be used to tell the difference between different samples. Of course, to do this the program must have lots of known data so it can play with lots of parameters and see how close its guesses are to the right answer. Hence, if we give the program 1000 images of different known scars and for each image give it 50 numbers that might or might not be helpful and leave it to try to work everything out it would give it a try but would probably take a very long time, and this is where the final clever computer code comes in, that of the genetic algorithm. This program will try combing a bunch of random parameter sets together and see if they are any better at estimating which scar type is which. If the first random guess might be say 60% correct while other might only be 4% accurate, the genetic algorithm then takes all the guess that were good and combines these solutions to create the next generation of solutions, again some will be bad but now others might be 80% accurate, this procedure is repeated until the program narrows in on a set of parameters that, when added together can easily tell us which images are of which scars. With this done the algorithm is said to be trained. The image, right, shows the output. There each coloured dot is a single image and as can be seen the different colours sit in different regions of the graph. Hence in a new defined process an unknown image can be assessed and then defined as one of the scar types. The next plot shows the accuracy of the algorithm to unknown data, at the end of a full test run we find that it is about 96% accurate, which is slightly better than a human operator, but can be much quicker.
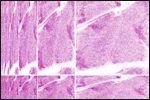
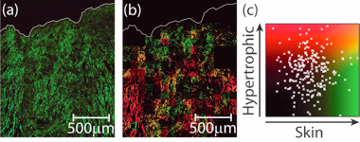 There is a final advantage to all the above work. When taking an image of a scar, we can instead of just calling it hypertrophic, we can say just how hypertrophic it is - where on the scar scatter plot the image is located. To show this in action the final graph is again a mature scar, now it has been cut up into many small pieces and each has been run through the algorithm. While every piece is accurately assigned the label of a mature scar, we can image the tissue in a false colour scale (b) to see what the individual areas looks like. This shows that the region of scar tissue near the skins surface (top) is most similar to normal skin (the scar has almost fully healed back to normal skin), whereas some of the more damaged parts of the tissue are looking more hypertrophic in nature. With this kind of technique, it might be possible to image a large scar and identify areas of concern within it, this could aid in the rapid identification of regions of potential worry.
Skin Photoaging Assessment
 Photoaging of skin occurs due to prolonged exposure of UV light. This process continues throughout our lives and can speed up the natural ageing process of skin, potentially making it more susceptible to skin conditions. To analyse the level of photoaging patients must currently undergo biopsies, but work is ongoing to use confocal microscopy to generate data cubes from tissue deep under the skins surface. Such methods are in their infancy but hold great promise due to removal of biopsies.
Confocal image stacks were taken from 53 people, covering a broad range of photo-damage and age, a number of image slices are shown opposite to give an idea of what can be seen. There are plenty of details and shapes within the images, highlighting that data analytics can be applied. Similar algorithms to those discussed above were used to analyse the images from all layers of the confocal stack. To reduce the data quantities, the dependence of the parameters was assessed over 4 distinct regions of skin depth, where it was identified that the parameters were stable. These corresponded roughly to the skin layers of the stratum corneum, viable epidermis and layers within the dermis. All parameters were then averaged over these regions and parameters were compared to training data to assess their use for predicting the level of photoaging. It was found that information from both Fourier transforms and image segmentation were of use when correlating the level of skin damage with the extracted image parameters, and using a combination of parameters as well as taking ratios of parameters between skin regions provided a clear correlation with the values obtained using human assessment.
Again, this work shows early progress in using automated algorithms to analyse often large and difficult data sets, and to produce results that are quick and easy to understand and remove any human bias errors. Continued work will consider the refinement of the techniques and assess whether they can indeed be used in therapeutic scenarios.
Papers relating to this work:
 Computational characterization of reflectance confocal microscopy features reveals potential for automated photoageing assessment
A.P. Raphael, T.A. Kelf, E.M.T. Wurm, A.V. Zvyagin, H.P. Soyer, and T.W. Prow.
Exp. Dermatol.22, 458-463 (2013)
 Scar tissue classification using nonlinear optical microscopy and discriminant analysis
T.A. Kelf, M. Gosnell, B. Sandnes, A.E. Guller, A.B. Shekhter, A.V. Zvyagin.
J. Biophotonics 5, 159-167 (2012)